


Blood transfusion rate and volume
This study included 912 patients who had undergone SO fusion. Among them, 662 (72.59%) received a blood transfusion within one week postoperatively, including 662 (72.59%) with red blood cells, 139 (15.24%) with platelets, and 299 (32.79%) with other blood products. In total, 250 patients (27.41%) did not receive blood transfusions. The mean total volume of blood transfused per patient was 1324 ± 1120 cc, comprising 926 ± 632 cc of red blood cells, 144 ± 378 cc of platelets, and 254 ± 382 cc of other blood products. Using the PSM method, we constructed a matched sample consisting of 232 patients in the transfusion group and 232 in the non-transfusion group, totaling 464 patients.
In the matched sample, the blood transfusion group comprised 112 men and 120 women, whereas the non-blood transfusion group comprised 121 men and 111 women. The SMD for sex was 0.08, suggesting that the sex distribution was well balanced between the two groups, and the difference was not statistically significant. The mean age was 64 ± 8.75 years in the blood transfusion group and 63.94 ± 9.26 years in the non-blood transfusion group (p < 0.7809), with an SMD of 0.03. There were no statistically significant differences between the transfusion and non-transfusion groups in terms of insurance type (p = 1.000, SMD = 0.00), hospital size (p = 0.7786, SMD = 0.10), season of surgery (p = 0.487, SMD = 0.06), or residential location (p = 0.7098, SMD = 0.05). All SMD values were below 0.1, indicating no meaningful imbalance across these baseline characteristics (Table 1). It is notable that several variables—such as sex (SMD = 0.64), age (SMD = 0.34), hospital size (SMD = 0.22), and season of surgery (p = 0.033)—showed statistically significant differences or considerable imbalance before PSM. However, after PSM, these differences disappeared, and none of the baseline characteristics remained statistically significant, indicating that the matching procedure effectively minimized confounding due to observed covariates.
Before PSM, there were statistically significant differences between the transfusion and non-transfusion groups in the prevalence of lung disease (p < 0.0001), kidney disease (p = 0.0126), peripheral neuropathies and myopathies (p = 0.0063), and ischemic heart disease (p = 0.0479). Among these, lung disease (SMD = 0.38) and peripheral neuropathies/myopathies (SMD = 0.21) showed notable imbalance with SMD ≥ 0.2. However, after PSM, none of the comorbidities showed statistically significant differences between the groups (all p > 0.05), and all SMD values were below 0.2. These results suggest that the matching process effectively reduced baseline imbalances in comorbidity profiles (Table 2).
Before PSM, women had a significantly higher risk of receiving a transfusion compared to men (HR, 1.476; 95% CI, 1.232–1.768; p < 0.0001). After PSM, no variables remained statistically significant predictors of transfusion. Sex, age, comorbidities, hospital size, season, location, and insurance type all showed non-significant associations with transfusion risk. These results suggest that the matching procedure effectively balanced baseline characteristics and minimized confounding in the assessment of transfusion risk, as previously significant predictors were no longer associated with the outcome (Table 3).
Mortality
Before PSM, the transfusion group consistently showed higher mortality rates than the non-transfusion group across all follow-up periods. Within 3 months after surgery, the mortality rate was 2.72% (18 patients) in the blood transfusion group and 0.80% (two patients) in the non-transfusion group (p = 0.0239, SMD = 0.15). Within 6 months of surgery, the mortality rate was 4.53% (30 patients) in the blood transfusion group and 1.60% (four patients) in the non-transfusion group (p = 0.0099, SMD = 0.17). Within 1 year after surgery, the mortality rate was 7.25% (48 patients) in the blood transfusion group and 4.00% (10 patients) in the non-transfusion group (p = 0.0426, SMD = 0.14). However, the differences in mortality rates were not statistically significant : 3-year mortality (12.43% in the transfusion group vs. 8.07% in the non-transfusion group; p = 0.0621, SMD = 0.14), 5-year mortality (14.58% vs. 11.24% ; p = 0.2622, SMD = 0.11), 10-year mortality (28.07% vs. 23.08%; p = 0.4407, SMD = 0.10). Over the entire study period, the mortality rates were 21.15% (140 patients) in the blood transfusion group and 17.60% (44 patients) in the non-transfusion group (p = 0.2341, SMD = 0.09) (Table 4).
Kaplan–Meier log-rank tests showed a statistically significant differences in overall survival between the transfusion and non-transfusion groups over the entire follow-up period (p = 0.0278) (Fig. 1). Additionally, a significant difference was observed at the 6-month follow-up (p = 0.0378), while other time points including 3 months (p = 0.0788), 1 year (p = 0.0715), and 3 years (p = 0.077) were not significant under the p < 0.05 threshold (Table 4). No significant differences were observed at 5 years (p = 0.2633) or 10 years (p = 0.4711).

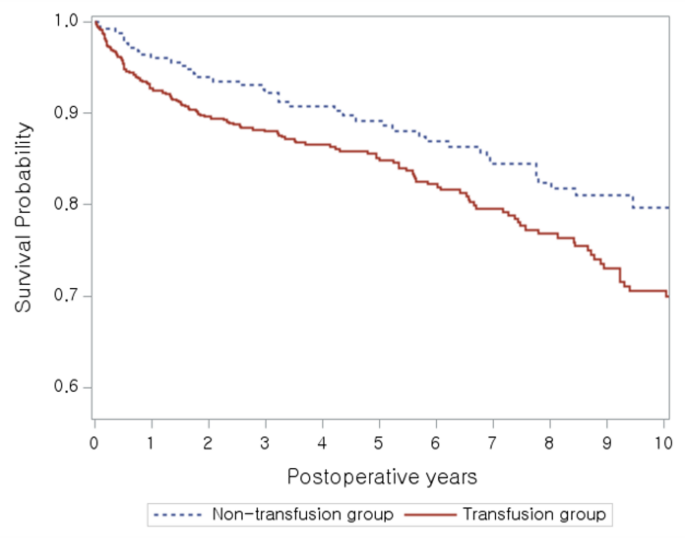
Kaplan–Meier survival curves for the unmatched cohort (n = 912). Overall survival (p = 0.0278 by log-rank test).
After PSM, no statistically significant differences in mortality were observed between the transfusion and non-transfusion groups at any follow-up point. Mortality rates were comparable at 3 months (0.43% vs. 0.86%, p = 0.5635), 6 months (2.16% vs. 1.72%, p = 0.7371), and 1 year (3.45% vs. 4.31%, p = 0.6315), as well as at 3, 5, and 10 years (all p > 0.3). Over the entire follow-up period, mortality was 17.67% in the transfusion group and 18.97% in the non-transfusion group (p = 0.7195) (Fig. 2). All SMDs were below 0.1, indicating sufficient covariate balance (Table 4).

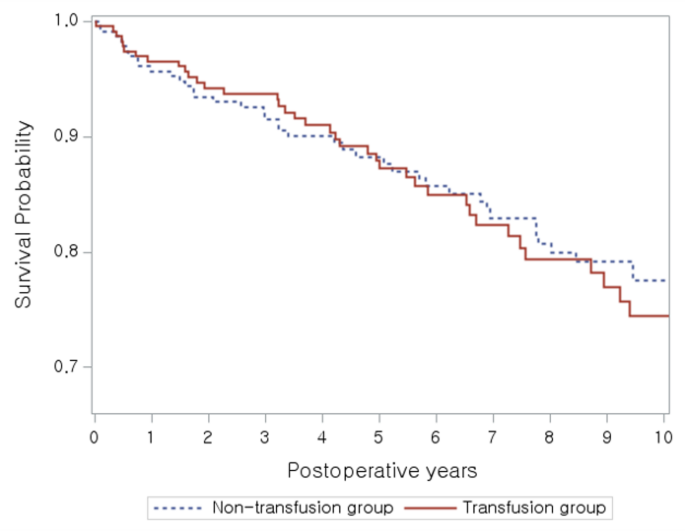
Kaplan–Meier survival curves for the propensity-matched cohort (232 matched pairs, n = 464). Overall survival (p = 0.9637 by log-rank test).
These findings suggest that the initially observed mortality differences were likely confounded by baseline characteristics, which were effectively minimized through propensity score matching.
link